What is Winnary?
Winnary is a roulette analytics service for inspecting patterns in recorded results. Its interface organises observations around a table and a pattern: what has occurred or remained absent, how long the observation has lasted, and how the source classifies its rarity. That is a more specific task than producing a list of “lucky” numbers.
Think of a roulette tracker as the record of what happened. Analysis adds structure to that record: a dozen has been absent, a column has not appeared, or a colour has repeated. Winnary adds historical context to the observation. The table identity, available sample and update time remain important; a visually striking card is not a substitute for those facts.
The interface examples on this page use simulated signals. Open Winnary to explore the service itself and the observations available there.
Roulette statistics: history, frequency and streaks.
Roulette spin history records the sequence of outcomes. Number frequency counts how often a number or group appeared. Roulette streaks describe consecutive outcomes or gaps, such as twelve spins without the first dozen. These measures answer different questions: a frequent number can still be absent from the most recent spins.
A roulette tracker helps organise that record; an analyser puts it in context. When reading roulette stats, compare the same table and time window. Historical frequency and pattern rarity describe the past, while the next independent spin keeps the same odds.
Reading roulette patterns: count and rarity.

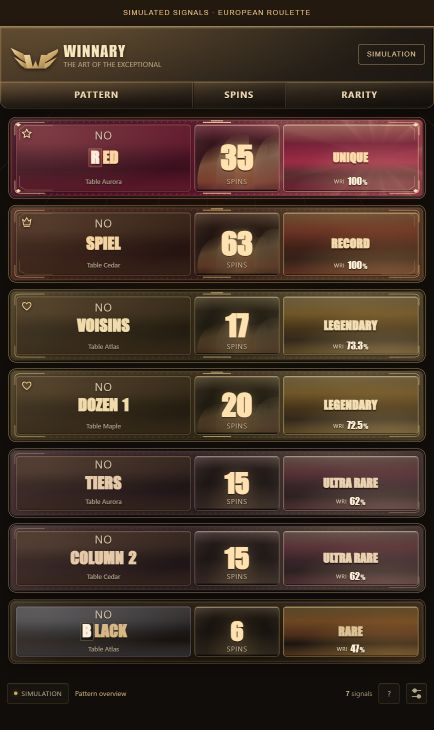
A screenshot from our labelled simulation. The historical sample is simulated; this is not a live table result.
- 01
Read the pattern literally
“NO DOZEN 1” means that numbers 1–12 have not appeared during the displayed absence. It does not mean they are due. A column groups a different twelve numbers; a sector describes neighbours on the wheel and may require several bets.
- 02
Check the count and the source
In the example, 20 is the length of the ongoing absence. It is not a prediction horizon. Compare observations only when you understand the pattern definition and the history behind them. Missing data and a count of zero have different meanings.
- 03
Read WRI as historical context
The Winnary Rarity Index combines how unusual a streak length is in the comparison sample with progress towards that sample’s maximum. A WRI of 72.5 is not a 72.5% chance of a hit. The next-spin odds still depend on how many pockets the chosen layout covers.
Roulette pattern rarity, explained.
The labels describe levels of historical rarity. Their interpretation depends on the observation window and the source’s classification. This guide uses the monthly comparison described for the project; Unique uses the separate six-month record window.
An observation entering the tracked range. It provides context before the higher rarity categories used in this strategy library.
An earlier entry class in our examples. The first-dozen short ladder shows a small attempt limit at this gate.
A higher historical classification, used here for dozens, columns and broad sectors. The Tiers example applies the gate to six splits.
A more exceptional classification in the comparison history. The original five-doubling rule demonstrates a fixed loss ceiling after entry.
A record is bounded by the period observed. Our record-entry rules require a strict break of the monthly maximum; a high class label by itself does not pass that additional test. Orphelins, records only is an example.
The distinct six-month record signal. In these simulations, the current streak must exceed the six-month maximum. One month or six months contrasts it with the monthly record gate.
See our methodology for the rarity assumptions used in these simulations.
From roulette statistics to a defined rule.
A roulette strategy needs more than a signal name. It needs a specific covered group, a stake schedule and an exit. In the library, those decisions are fixed before revealing the future spins. Some examples use equal stakes; others double after a miss and stop at a declared cap.
The mixed-signal strategies show how entry requirements can differ across patterns. A large sector can use Ultra Rare while Orphelins waits for a monthly record. Each branch has its own explicit limit. These examples explain possible uses of the interface; they do not establish that waiting for a rarer pattern improves the next result.
Start with the saved roulette simulator to follow the accounting, or the roulette odds chart to understand coverage. Then open Winnary to inspect how the current service presents its own observations.
Is Winnary a roulette predictor?
No. A roulette analyzer describes supplied results; a roulette predictor would need evidence that it can forecast unseen outcomes. Roulette prediction software is often searched for as if the two tasks were interchangeable. They are different claims. On the independent, uniform wheel used here, past misses do not change the next-spin probability.
Roulette results history can still be useful for checking a statement, comparing pattern definitions and understanding what a record covers. It cannot turn an observed streak into a guaranteed next number. Our simulations keep the full result, including every loss, so a positive example is not offered as proof of predictive power.
Explore the actual service.
Afterpattern is a companion educational publication for Winnary. The service links lead to the main product website. This is not an independent customer review, and the simulated figures are not customer performance claims.
Open Winnary ↗Product description checked against the official About page and Analytics page. Access options can change; see the main website for current details.